Table of Contents
1. Introduction
Ignition is an industrial application platform for collecting data, designing, and deploying industrial applications throughout an enterprise. It empowers the creation of any kind of industrial application including SCADA, MES, IIoT, reporting, alarming and more.
One of the benefits of Ignition is that you can move projects between Gateways, and that includes the Gateways of different editions of Ignition.
This guide will explain how to make an export of a standard Ignition project and import it into an Ignition Edge Gateway.
There are 3 main topics that will be covered in this guide:
- Overview of Projects
- Project Export
- In Standard Ignition
- In Ignition Edge
- Project Import
- In Ignition Edge
- In Standard Ignition
These topics are described in greater detail in the following sections.
2. OPC UA Data Collection
OPC UA is used to collect data local to the source. Logging sessions are created by the OPC UA collector, and each session can be configured. Data like the tag names and dead-banding, in conjunction with data transformation can be configured. The Canary Sender Service encrypts and compresses the logging data end sends it to the Receiver Service. The Receiver can accept data from one or more Senders and can redirect it to the Canary Historian Database.
The first step is to create logging sessions in the data collector:
- Launch the Canary Admin application that is installed locally on the OPC Server. Navigate to the “OPC Collector” panel.

2. Firstly, from the menu at the bottom of the page, select the “Configuration” option. Secondly, from the left-side panel choose the “Sessions” option.
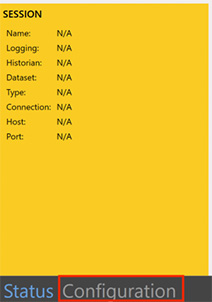
3. Click on “New Session”. This will open a “Session Settings” window.

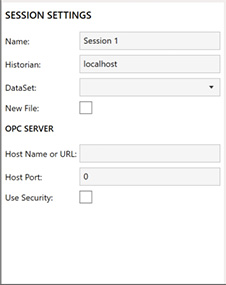
- Specify a name for the session.
- Specify the historian/s the data should be sent to by entering its names in the Historian text box. You can specify the machine name or IP address. If you have multiple historians, you can separate them with a comma.
- Create a dataset manually by entering a name for it or select a dataset from the dropdown to which the data will be logged to.
- The “New File” option is there if you wish to create a logging file revision. It lets the Historian release tag licensing for tag names that don’t appear in this new session.
- Add the OPC server machine name or URL in the “Host name or URL” text box. If you are local to the machine, you can use “localhost”.
- And lastly, add the host port.
4. You can save these settings by clicking on the “Apply” button at the top of the screen in the red bar

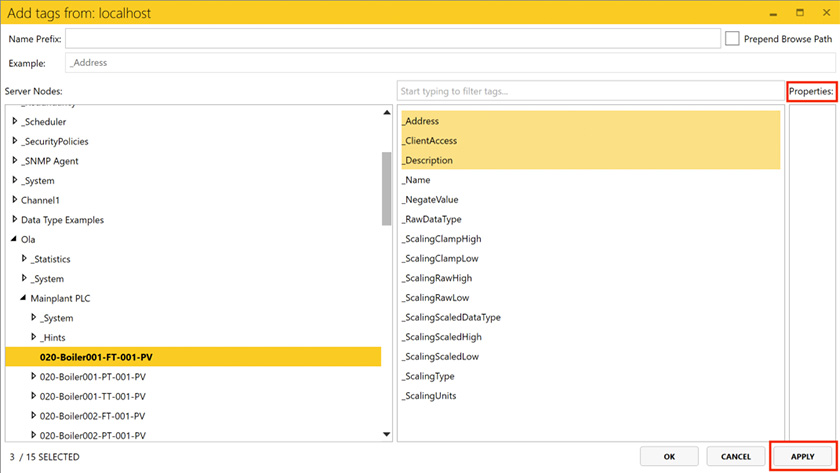
5. Click on “Browse” in the Tags Window.

6. This is where you can browse the OPC Server and choose the tags you want to log by using your mouse and the Shift key to highlight them. After selecting the tags, you can choose the properties according to your needs by checking available properties listed in the “Properties” window. Click “Apply” to log the selected tags and “OK” once done.
7. You should now see all of your tags in the OPC collector under your new logging session.

3. Starting and Stopping Logging Sessions
To start logging the data, click on the “Select” option from the menu at the bottom of the screen.
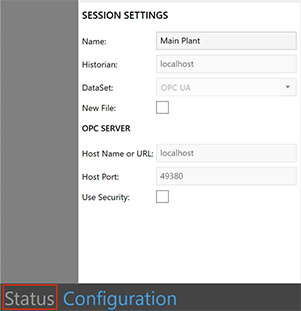
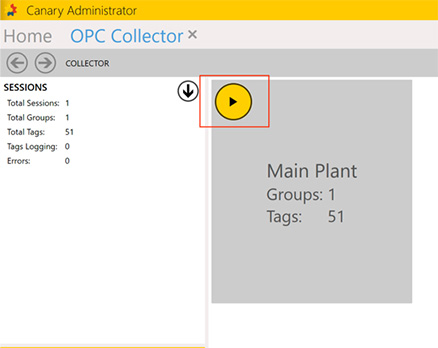
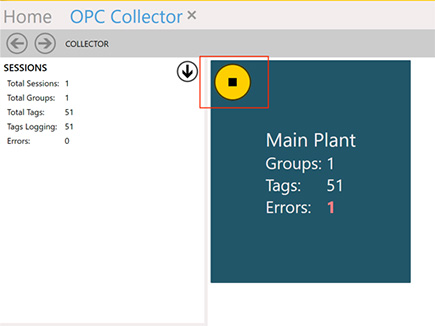
There will be a grey tile for every session created. Click on the play icon to start logging the data for that session. The tile will turn blue once it has started. And to stop the logging, click on the stop logo.
4. OPC DA Data Collection
The OPC DA Collector can read data from an OPC DA server and send that data to the Canary Sender Service. The OPC DA data logger should be configured in the Canary Admin application first, and then the data should be logged in the Logger Administrator application.
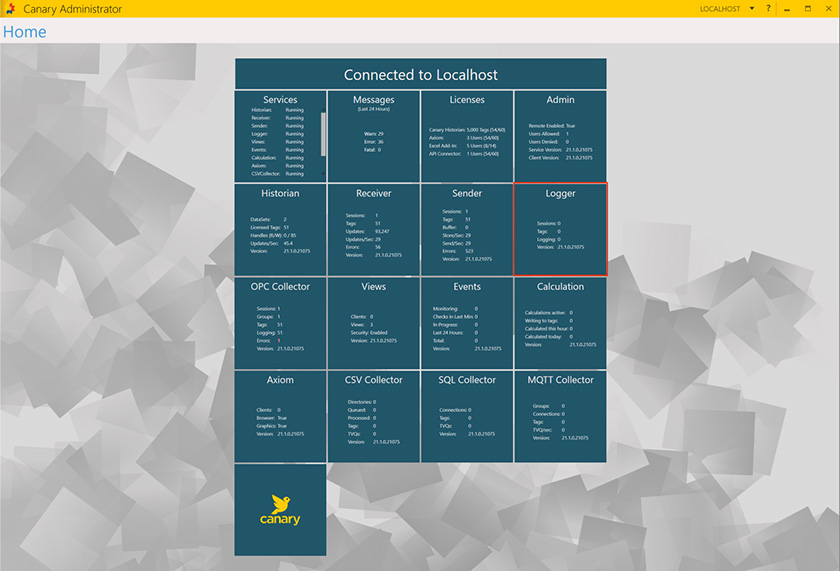
- Open the “Logger” panel
2. There will be only 2 options in the Logger window; Run As and Arguments. Run As is a drop down list of choices on how to run the processes.
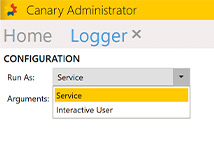
a. Service – It registers the CLILogger.exe as a service that is set to automatic and starts it. If any arguments are passed in while this option is chosen, it will be executed on startup.
b. Interactive User – The CLILogger.exe will run and the credentials of the currently logged in user will be used. If any arguments are passed in while this option is chosen, it will be added to a shortcut for the CLIHistStart.exe and placed in the Startup folder to be executed at logon.
3. Arguments are the command line parameters that will be executed by the above mentioned service or interactive user.
5. Creating Logging Sessions and Logging Data
From your OPC Server, launch the Logger Administrator application. Your computer name will be displayed in the place of the black blocks.
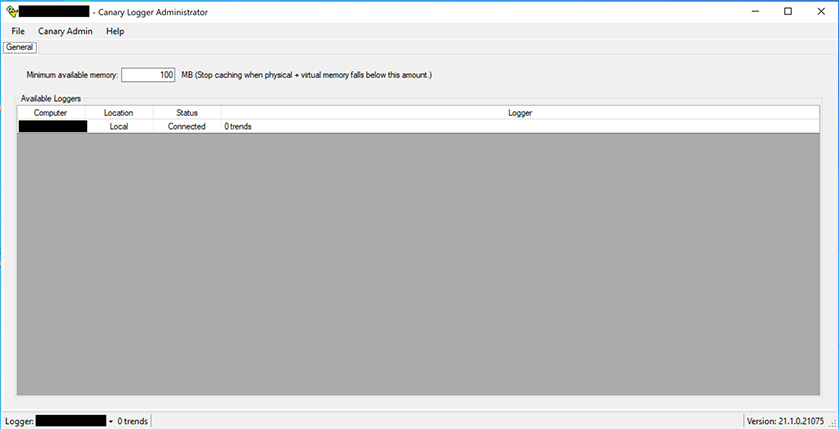
- You can adjust the value in the “Minimum available memory” field to adjust the memory threshold. Logging sessions automatically cache data to your local memory.
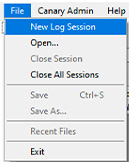
- Click on “File” and select “New Log Session”
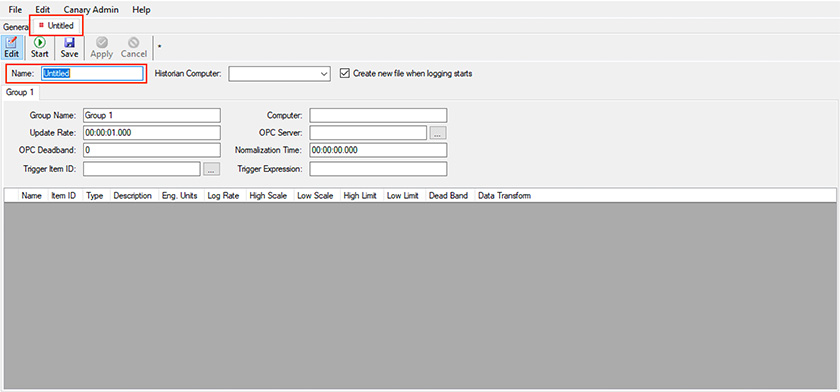
3. A new tab named “Untitled” will appear. Rename your logging session in the “Name” field, and the tab name will change accordingly.
4. In the “Historian Computer” field, enter the machine name or IP address of the Canary Historian you are using. If you want to log data to more than one historian machines, separate the names with commas.
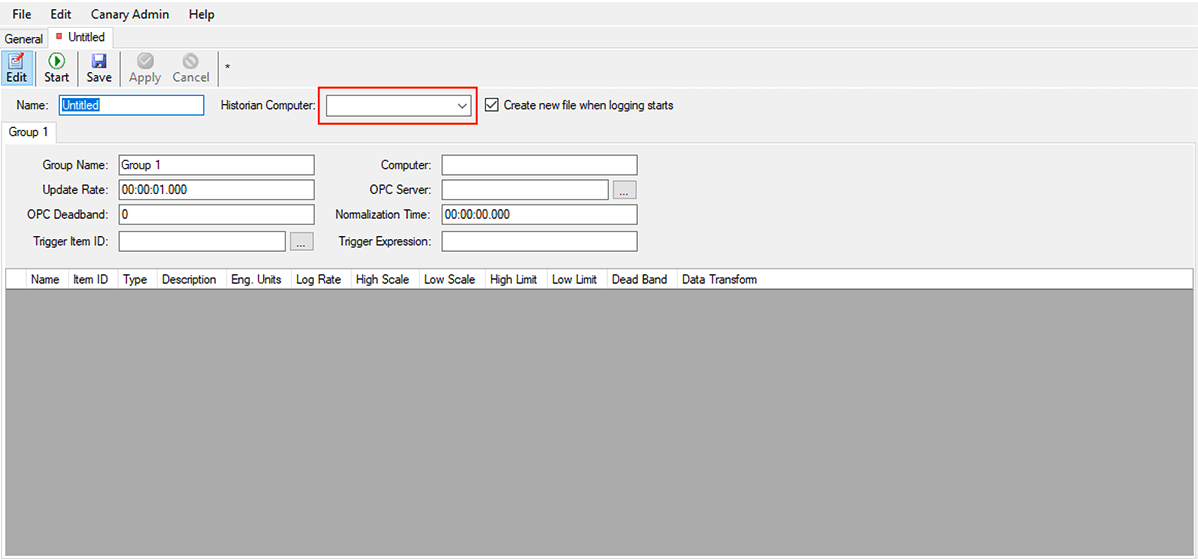
5. The option to “Create a new file when logging starts” enables you to create a logging file revision. It lets the Historian release tag licensing for tag names that don’t appear in this new session.
6. The tab with the name “Group 1” shows that Group 1has automatically been created. To create more groups, right click on the Group 1 tab and select “Add new group”.

7. Change the group name if required. Enter the machine name or IP address of the OPC Server if not local. If it is, leave the field black.
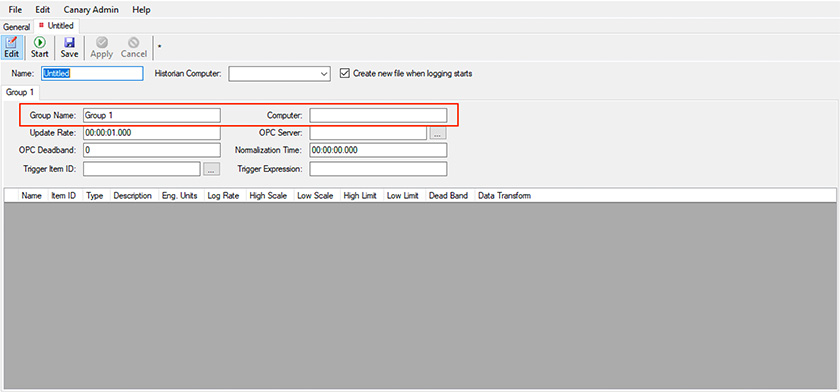
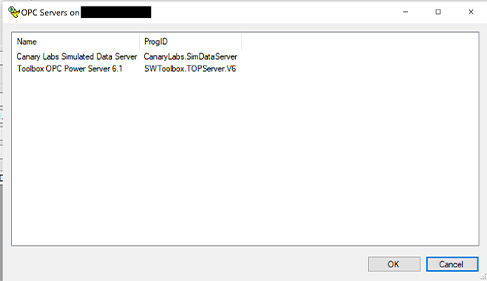
8. To select the OPC Server, click on the ellipse … icon next to the “OPC Server” option. A screen will pop-up which will allow you to browse between your OPC Servers.
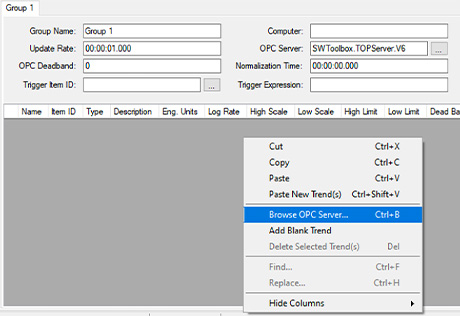
9. Once you have selected your OPC Server, right-click on the dark grey window area below the group settings tab and choose the “Browse OPC Server”. Alternatively, you can press Ctrl + B.
10. A new window will pop up where you can add trends. In the “Name Prefix” dropdown, select the dataset in which to log the data. If there are no datasets available to choose form, you need to exit the window and create a dataset on the Canary Historian Server.

11. In the “Server Nodes” window you can browse the OPC Server structure to find the desired tags. Once you have clicked on the tags, and they are visible in the right hand window, select all individual tags required. Use Shift to multi-select tags.
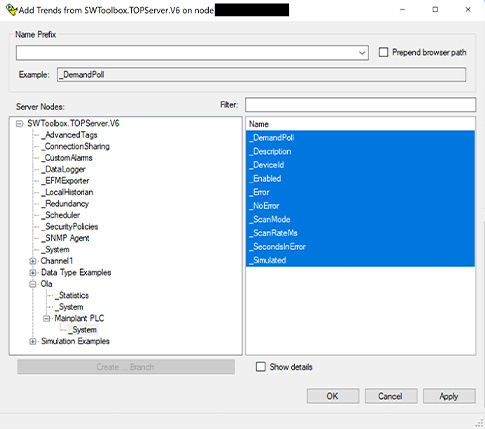
12. If you wish to prepend the tag name with its browse path, click on the “Prepend browser path” option. Click on the “Apply” button to select the tags which you want to log. Click “OK” when done
13. A table will appear with all of the tag you selected. To select a tag row, click on the corresponding block for that row in the first column which is empty. To edit a cell, yu can double click on it.

14. To delete a row, select the row and right-click to select the “Delete Selected Trend(s)” option.
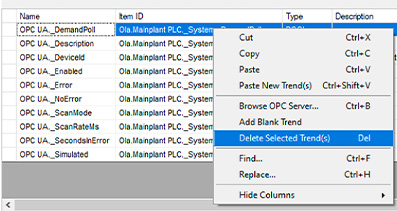
15. Apply and save your changes at the top of the window. Click on the “Start” button to start logging data.


16. If your data is logging correctly, you will see the following at the bottom of the window, where your computer name will be displayed in place of the black box.

6. Summary
To connect to an OPC UA or OPC DA server to collect data in Canary, here is a summary of what you need to do:
- Setup the OPC Collector for OPC UA data collection in the Canary Admin application
- Start the logging sessions
- OR Setup the OPC Collector for OPC DA data collection in the Canary Admin application
- Create logging sessions and log the data in the Logger Administrator application
For additional resourcing, please direct yourself to the Canary user manual.


